Introducing genome subway maps
It's no secret, data visualization is more appealing than bare tables with floating numbers and integers. And visualization can be dynamic and responsive too, if designed correctly. In November 2012, I started to work on a pet project called Ray Cloud Browser. From the name, you can tell that it's something to browse stuff related to astronomy: rays and clouds. In fact, that's untrue. Ray Cloud Browser is a data browser that can run in the cloud -- an abstraction for virtualized hardware that you pay by the hour. Ray is just the brand name of the products I am working on during my doctoral projects.
Ray Cloud Browser is open source and free software. It's all on github with nice documentation and all that. Anyway, enough with the chitchat.
The first picture I want to share is this view that illustrates repeated regions in a genome. It's very like a subway map, hence the title of this post.

You can visit this subway location by yourself here. The demo is running on a t1.micro spot instance on Amazon EC2.
It's even possible (boom!) to have a menu when navigating this genetic map in the cloud.

The visual landscape of regions that are unique in a genome (or in a metagenome, transcriptome, or whatever -ome you deem the best for you) are more calm and simple, like the one below.
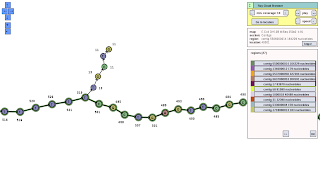
In the scientific literature, repeats are usually described as simple branching points in the string graph. Well, some of them are simple (such as the one below in the picture), but most of them are complex with repeats within repeats (worlds within worlds).

My backlog is almost depleted, meaning that soon Ray Cloud Browser will be full of features.
There is a short guide on how to deploy this super-cool software for your own use.

Comments