Cost of hosting Ray Cloud Browser during 1 month in AWS EC2
I got this question on Twitter: what has your bill totaled since you've started hosting ray viewer?
I guess ray viewer is just another name for Ray Cloud Browser ;-P.
For one month, I expect the costs to be at least 2.1915 $ (365.25/12*24*0.003) for my t1.micro spot instance and 6.4000 $ (64 * 0.10) for my 64 GiB Amazon EBS Standard volume. I/O requests are hard to predict, and I did run some I/O intensive workloads that were unrelated to Ray Cloud Browser during this period on my t1.micro instance. My resources are located in the availability zone us-east-1a.
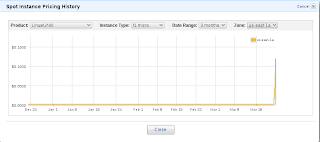
Here the pricing history for t1.micro spot instances in the us-east-1a availability zone.
Figure 1: Pricing history for t1.micro spot instances in the us-east-1a availability zone. Data are from Amazon Web Services API. The vertical axis is a by-the-hour price.
Using the Cost Allocation Feature, I generated (with a home-baked Ruby script) a pivot table for my operation costs in the cloud during the month of February 2013.
Table 1: Cost Allocation report for the period 2013-02-01 to 2013-02-28.
Table 2: Cost Allocation report for the period 2013-03-01 to 2013-03-22.
I guess ray viewer is just another name for Ray Cloud Browser ;-P.
For one month, I expect the costs to be at least 2.1915 $ (365.25/12*24*0.003) for my t1.micro spot instance and 6.4000 $ (64 * 0.10) for my 64 GiB Amazon EBS Standard volume. I/O requests are hard to predict, and I did run some I/O intensive workloads that were unrelated to Ray Cloud Browser during this period on my t1.micro instance. My resources are located in the availability zone us-east-1a.
Here the pricing history for t1.micro spot instances in the us-east-1a availability zone.
Figure 1: Pricing history for t1.micro spot instances in the us-east-1a availability zone. Data are from Amazon Web Services API. The vertical axis is a by-the-hour price.
Using the Cost Allocation Feature, I generated (with a home-baked Ruby script) a pivot table for my operation costs in the cloud during the month of February 2013.
Table 1: Cost Allocation report for the period 2013-02-01 to 2013-02-28.
| Project=Ray-Cloud-Browser-public-demo | ||||
| Product Code | Usage Type | Units | Usage Quantity | Total Cost ($) |
|---|---|---|---|---|
| AWSDataTransfer | DataTransfer-In-Bytes | GB | 0E-8 | 0.0 |
| AWSDataTransfer | DataTransfer-In-Bytes | GB | 0.33359259 | 0.0 |
| AmazonEC2 | SpotUsage:t1.micro | instance-hours | 550.00000000 | 1.652045 |
| AmazonEC2 | EBS:VolumeUsage | GB-months | 58.92857279 | 5.893582 |
| AmazonEC2 | EBS:VolumeIOUsage | I/O requests | 66575670.00000000 | 6.656853 |
| AWSDataTransfer | DataTransfer-Out-Bytes | GB | 0E-8 | 0.0 |
| AWSDataTransfer | DataTransfer-Out-Bytes | GB | 0.54077656 | 0.0 |
| AWSDataTransfer | DataTransfer-Out-Bytes | GB | 0E-8 | 0.0 |
| AWSDataTransfer | DataTransfer-Out-Bytes | GB | 3.18717216 | 0.383951 |
| AWSDataTransfer | DataTransfer-Regional-Bytes | GB | 0.00054671 | 7.3e-05 |
| Total= | 14.586504000000001 | |||
Table 2: Cost Allocation report for the period 2013-03-01 to 2013-03-22.
| Project=Ray-Cloud-Browser-public-demo | ||||
| Product Code | Usage Type | Units | Usage Quantity | Total Cost ($) |
|---|---|---|---|---|
| AWSDataTransfer | DataTransfer-Regional-Bytes | GB | 0.00050045 | 0.009971 |
| AWSDataTransfer | DataTransfer-In-Bytes | GB | 5.56271202 | 0.0 |
| AmazonEC2 | SpotUsage:t1.micro | instance-hours | 515.99615014 | 1.681617 |
| AmazonEC2 | EBS:VolumeUsage | GB-months | 50.03225975 | 5.003363 |
| AmazonEC2 | EBS:VolumeIOUsage | I/O requests | 135159802.27951210 | 13.515314 |
| AWSDataTransfer | DataTransfer-Out-Bytes | GB | 10.11928072 | 1.215252 |
| AWSDataTransfer | DataTransfer-Out-Bytes | GB | 0.28797433 | 0.0 |
| Total= | 21.425517 | |||

Comments
Did you know that you can get these ON AUTO-PILOT & ABSOLUTELY FOR FREE by registering on Add Me Fast?