Metagenome lumps & artifactual mutations
Hey !
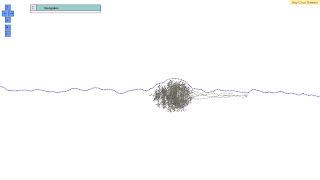
A recent arXiv manuscript by the group of Professor C. Titus Brown revealed "sequencing artefacts" in metagenomes. In this work, the authors discovered topological features in de Bruijn graphs that they called "lumps."
In the Microbiome40 sample (confidential stuff I guess ;-)), a collaborator observed these metagenome lumps using Ray Cloud Browser (public demo on Amazon EC2; source code on GitHub).
Here are some nice pictures of this system.
Ray assembly plugins are shielded against these as the algorithms are well-designed.
Another recent paper in Nucleic Acids Research by a group at the Broad Institute carefully documented "artifactual mutations" due to particular events during sample preparation.
Also using Ray Cloud Browser, we observed these topological features in the de Bruijn graph on Illumina MiSeq data, namely the public dataset called "E.Coli-DH10B-2x250".
Here are a nice picture of a bubble -- a branching point in the graph where two high-coverage are competing. One of them (the strong part, in blue) has a high coverage (>200 X) where as the weak part has a lower coverage around 20-30 X.
20-30X cannot be obtained with random sequencing errors. (edited the word not).
edit: "Yes, it can. GGCxG error in Illumina data."
This will look like genuine SNPs.
edit: "remember when you sequence bacteria you are sequencing a population"
A recent arXiv manuscript by the group of Professor C. Titus Brown revealed "sequencing artefacts" in metagenomes. In this work, the authors discovered topological features in de Bruijn graphs that they called "lumps."
In the Microbiome40 sample (confidential stuff I guess ;-)), a collaborator observed these metagenome lumps using Ray Cloud Browser (public demo on Amazon EC2; source code on GitHub).
Here are some nice pictures of this system.
Ray assembly plugins are shielded against these as the algorithms are well-designed.
Another recent paper in Nucleic Acids Research by a group at the Broad Institute carefully documented "artifactual mutations" due to particular events during sample preparation.
Also using Ray Cloud Browser, we observed these topological features in the de Bruijn graph on Illumina MiSeq data, namely the public dataset called "E.Coli-DH10B-2x250".
Here are a nice picture of a bubble -- a branching point in the graph where two high-coverage are competing. One of them (the strong part, in blue) has a high coverage (>200 X) where as the weak part has a lower coverage around 20-30 X.
20-30X can
edit: "Yes, it can. GGCxG error in Illumina data."
This will look like genuine SNPs.
edit: "remember when you sequence bacteria you are sequencing a population"


Comments
Charles Joly Beauparlant.