Visualizing autonomous components in de Bruijn graphs
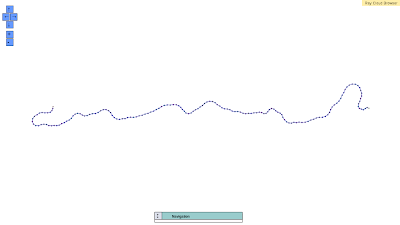
In Ray Cloud Browser (demo on Amazon EC2), I just found some interesting bits: autonomous components occurring in free form in a de Bruijn graph.
You can see these yourself by going at the location displayed in the figures below.


I am working on these strange things in the graph because those useless parts consume a sizable amount of compute time. So instead of patching this problem downstream (i.e.: removing the dust), I decided to write Ray Cloud Browser to fix things in the right places (i.e.: removing the source of dust instead of the dust being produced).


I am working on these strange things in the graph because those useless parts consume a sizable amount of compute time. So instead of patching this problem downstream (i.e.: removing the dust), I decided to write Ray Cloud Browser to fix things in the right places (i.e.: removing the source of dust instead of the dust being produced).

Comments